Features & Waves
General
- A feature is a technical or business property that develops over time. Examples of features are weight, cost price, key function, etc. Feature values over time can be used for progress planning and tracking, but also for benchmarking with competitor trends and regulatory developments.
- A wave is essentially an alignment of multiple contributing technologies reaching a capability level on one or several features, that jointly enable the development of one or more products and/or services. In other words: waves enable the bundling of feature milestones across the portfolio, and can also be used as a way of grouping projects or managing dependencies.
Where to find
Taskbar: 'Features' and 'Waves'
Create new feature / edit feature
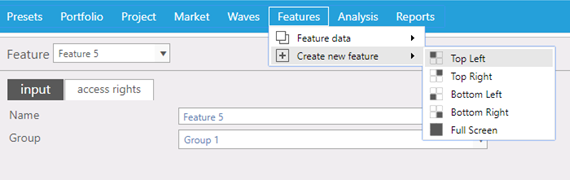
- Go to 'Features' in taskbar end select 'Create new feature'
- Name the feature and select Group
- Edit by rename feature and/or reselect Group
Create new wave /edit wave
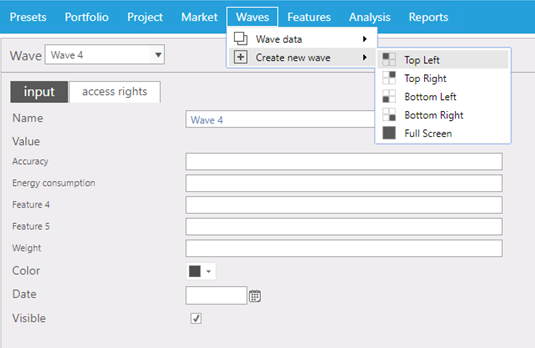
- Go to 'Waves' in taskbar and select 'Create new wave'.
- Name wave and add feature values where relevant.
- Select color of wave to be plotted in in roadmap chart.
- Select date of the wave using the calendar button.
- Choose if you want to make the wave visible in the roadmap chart.
- To edit data of existing wave: go to 'Waves' in taskbar, select 'Wave data' and select 'Wave'.
Populate waves with projects
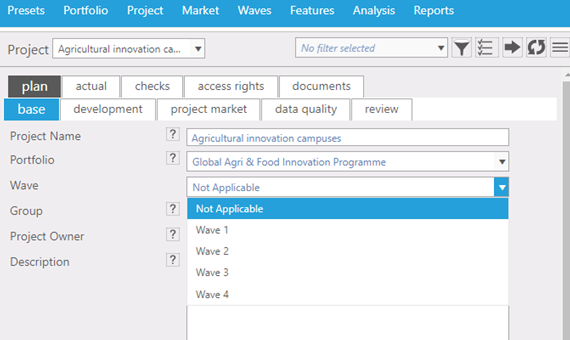
- Go to 'Project' in taskbar, open 'Project data', select project, go to Plan-Base tab.
- Click on drop down field of 'Wave' and select wave to link project to.
- A project can be linked to none or one wave.
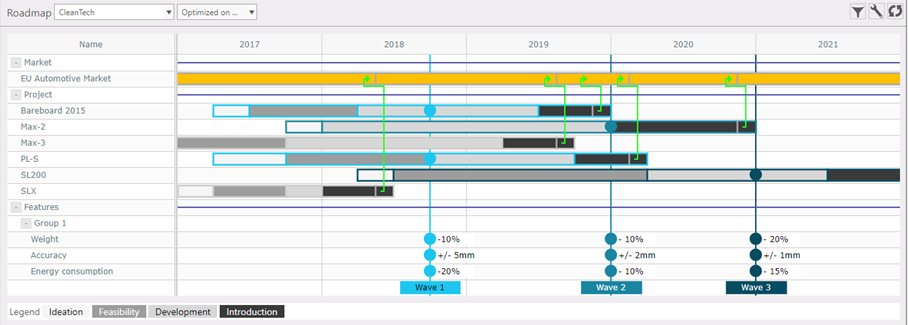
Show waves and features in Roadmap chart
- When one or more projects are linked to wave, wave will be shown (if checked 'Visible).
- Features and feature values on the waves will be shown when option 'Show features' is checked in Roadmap configuration menu. (Roadmap Configuration panel)