Roadmap
General
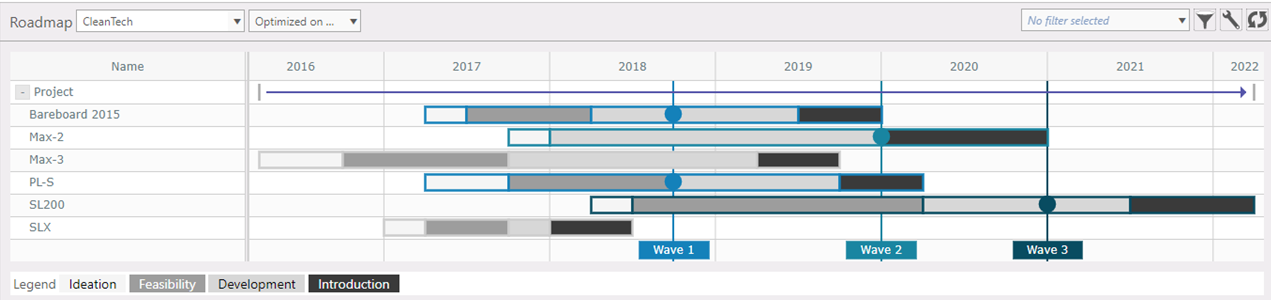
The function Roadmap provides you with information about the life cycles of the projects in a portfolio or a subset of projects. The Roadmap chart visualizes the start, life cycle stages, and end of projects. It also gives insight how projects relate to each other in terms of timing, duration, and dependencies. Besides projects, the roadmap chart also shows:
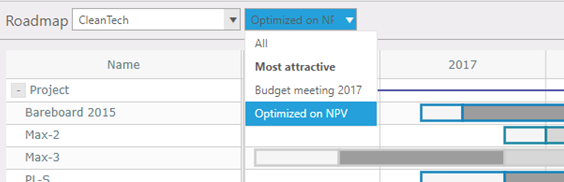
Based on the portfolio selected, a set of projects is shown with the linked markets and waves. If a feature value is entered for a wave and a feature priority is set for the portfolio (portfolio data > features tab), the concerning features are shown. Where to find Taskbar: Portfolio > Roadmap. Options:
|