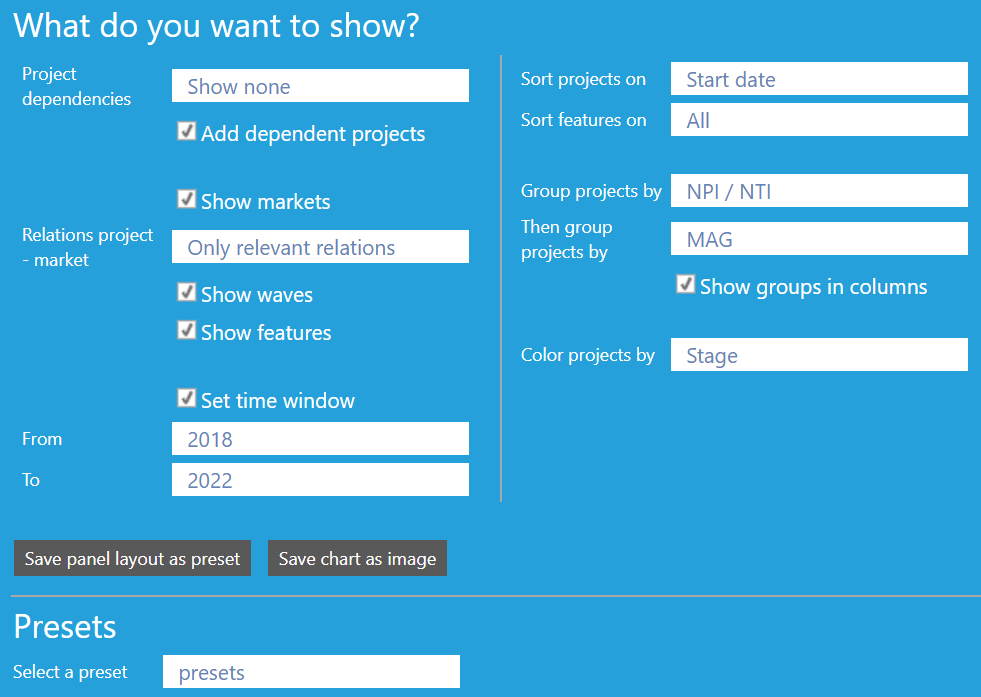
Show markets (see figure 5)
- Add life cycle of markets the projects are addressing
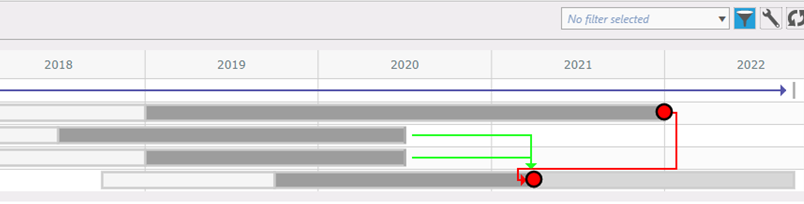
- Relations project - market: select relations you want to be shown (All relations, Hide relations, Only relevant relations)
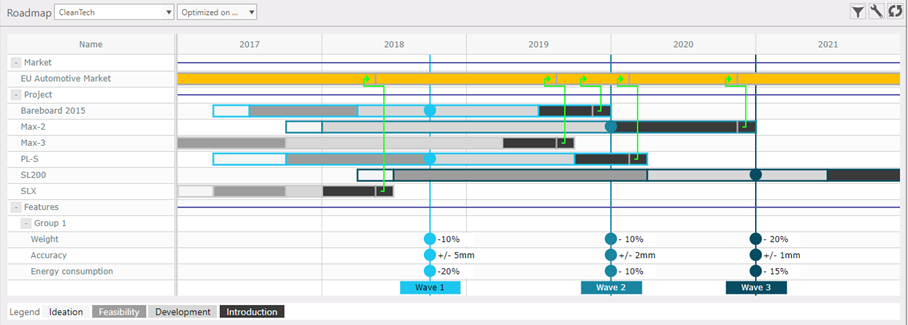
Figure 5: Project-market relations, Features, Grouping & Subgrouping
Show waves (see figure 5) (Features & Waves)
- Add waves to the Roadmap chart (only waves that are linked to the projects in the chart are shown)
Show features (see figure 5) (Features & Waves)
- Add features and their values over time to the Roadmap chart. The configuation of features is depicted in the figure below.
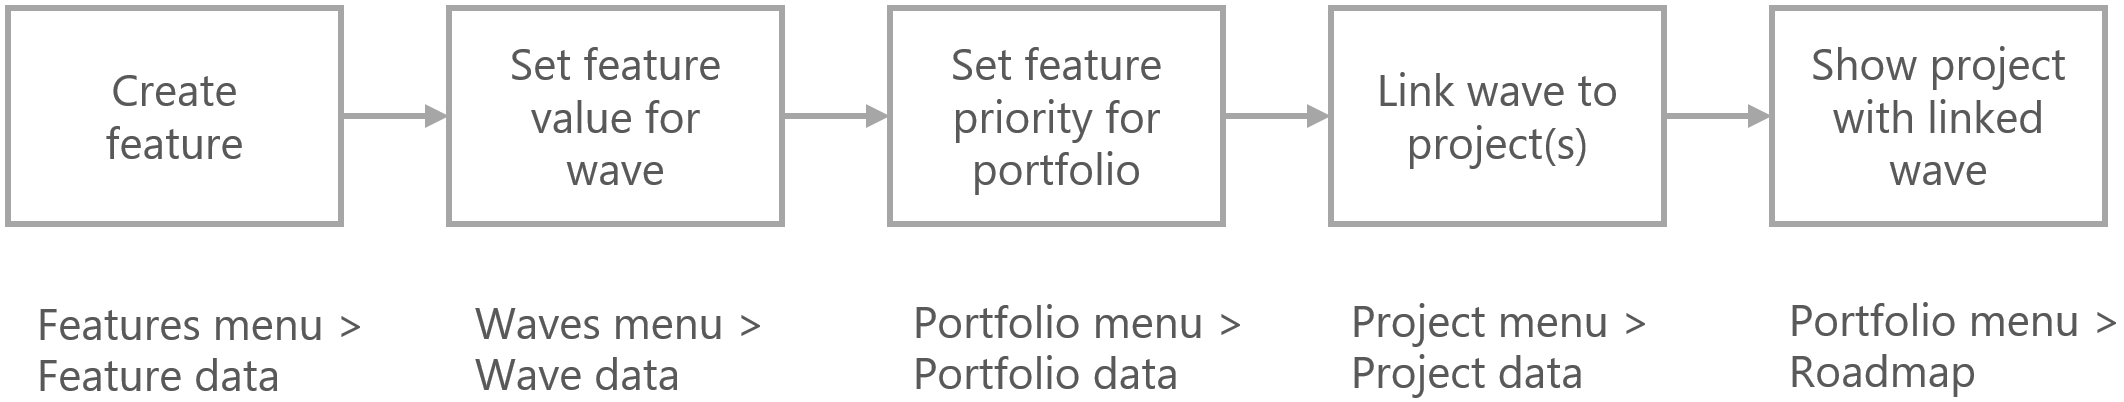
Figure 6: How to configure and show features in roadmap chart
Set time window
- Select start and end of time window, for zooming-in on specific period
Sort projects on
- Start data
- Name
- Dependencies: project with earliest start data is shown first, followed by the dependend projects (not possible if grouping is enabled)
- Wave: projects linked to the earliest wave are shown at the bottom of chart (closest to the wave)
Sort features on
- Within a portfolio (Portfolio menu > Portfolio data > features tab) the priority of features can be set. By default (option: All), the roadmap chart sorts the features on the priorities of the portfolios of the projects shown (sum of the portfolios to wich the projects link).
- Select a portfolio to sort the features on the priorities set in the concerning portfolio.
|
|
Group projects by & Then group projects by (subgrouping)(see figure 5)
- Select grouping option for projects and markets, e.g. by project type or portfolio
Color projects by
- Color the projects depending on e.g. actual stage, group, data quality, etc.
Save panel lay-out as preset: Presets
Save chart as image:
- Create svg image and save in preferred folder
|
|