General
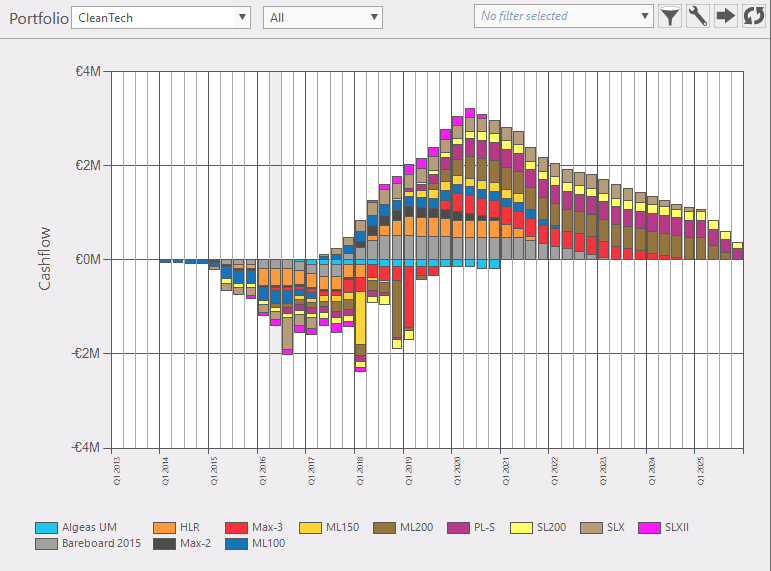
Figure 1: portfolio over time graph
This function provides an overview of values in a portfolio over time graph.
Where to find
Taskbar Portfolio > portfolio over time
Options:
- Active portfolio: use drop down to change the active portfolio (fig. 2).
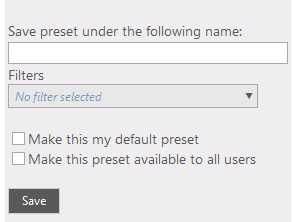
 Filters: filter on projects. Filters: filter on projects.  Configuration panel: in this panel you can select which data will be plotted (fig. 4). After you have selected the desired data it can be saved as a panel preset. Options to select: Configuration panel: in this panel you can select which data will be plotted (fig. 4). After you have selected the desired data it can be saved as a panel preset. Options to select:
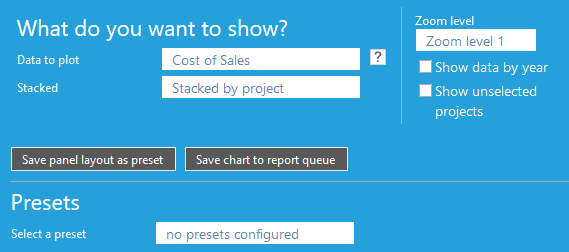
Figure 4: select preset conditions
- Data to plot; (fig. 5) choose data to plot on the y-axis from dropdown menu.
|
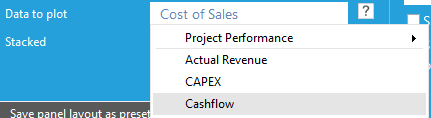
Figure 5: select from dropdown the desired data
|
- Stacked; (fig. 6) do you wish the data to be stacked (fig. 7b) or not to be stacked (fig. 7a).
- Zoom level; select time window to plot (zoom level1, zoom level2, zoom level3). These levels can be set in system settings (Administration >> system settings >> view)
- Show data by year; (plot time on x-axis in years or quarters) (fig. 1 in quarters, fig. 7 in years)
|
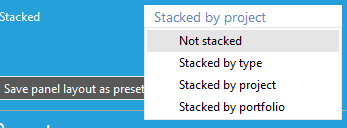
Figure 6: select from dropdown if the bars must be stacked or other options.
|

Figure 7a: bars not stacked
|
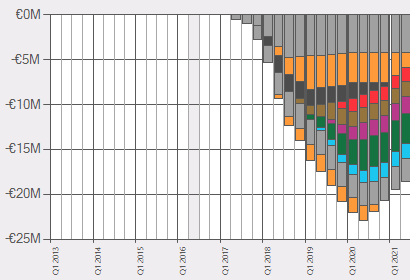
Figure 7b: bars stacked by project.
|
- Show unselected projects (fig. 8); this option is only visible when the graph is plotted in stacked by project.
|
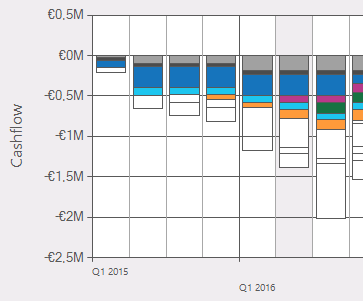
Figure 8: show also unselected projects (white colored)
|
- Show constraints: when constraints are set (in portfolio data) for the data you want to plot, the option show constraint (fig. 11) will show the gray line of constraints. In this example the net costs may not exceed the set constraint for that year.
 Export data. Export data.
 Reload: refreshes the window. Reload: refreshes the window.- Hovering over a graph (fig. 10): this will give some information of that item.
- Selecting project of the graph; by clicking on a project in a bar.
|
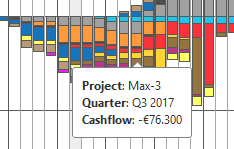
Figure 10: info by hovering over a bar
|
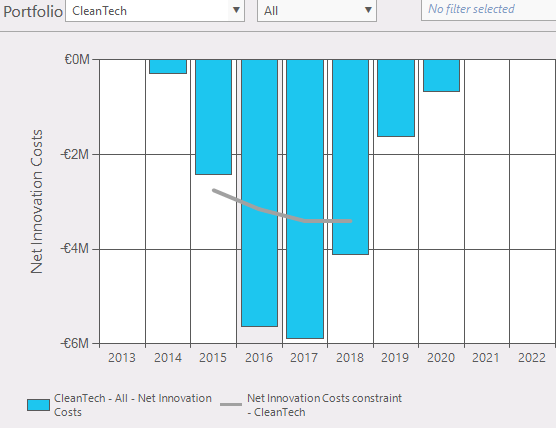
Figure 11: constraints (grey line) in the portfolio over time graph
|