General
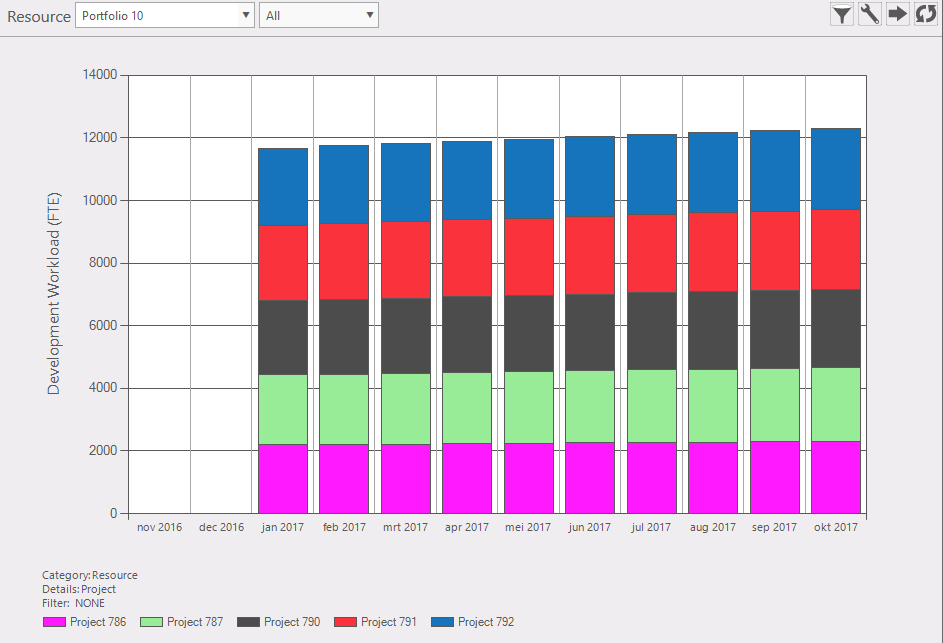
Figure 1: resource planning chart
This function provides an overview of the total amount of resources needed for a portfolio in an overtime chart or table in months, quarters or years.
Where to find
Task bar Portfolio >> resource planning.
|
|
Resource preset settings
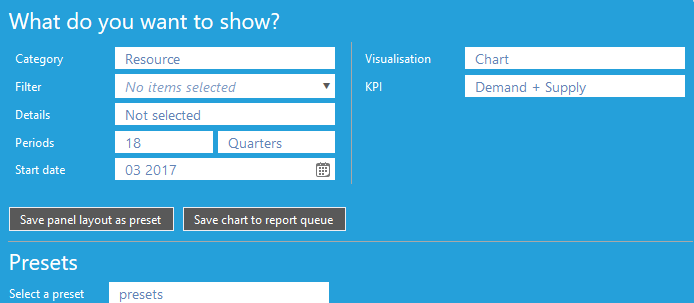
Figure 3: Preset resource panel
|
|
Scope:
- Category: If your company uses a model with Resource types, you can choose to display Resource data or Resource type data. When a Resource Type category is chosen, you can filter on the items of the resource type.
|
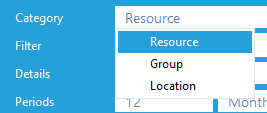
Figure 4: Select Category Resource Type Preset
|
- Filter: Select resources or resource types that will be displayed (fig. 5).
|
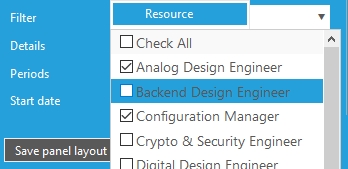
Figure 5: Select Resource Preset
|
- Details (fig. 6) Set the detail level of the presented data. These detail levels are available:
- Not Selected: Table shows total resource data (fig. 16), or totals per resource type
Chart shows unstacked resource, or stacked per resource type.
- Resource: Table shows totals per resource, or totals per resource type and then resource. Chart shows stack per resource.
- Project: Table shows totals per resource and then project, of resource type and then project. Chart shows stack per project (fig. 7).
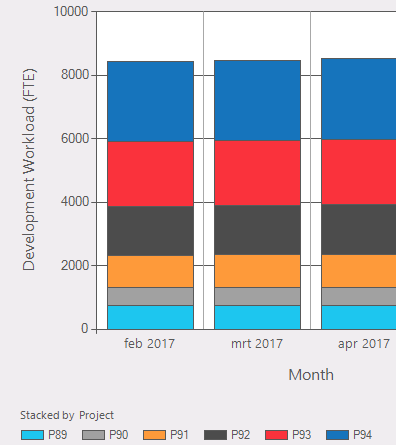
Figure 7: Project Details, here stacked by project
|
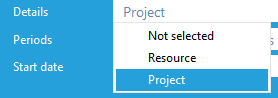
Figure 6: Details Preset
|
- Periods: Select number of periods (1 .. 24) (fig. 8)
|
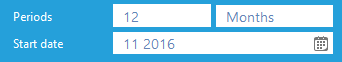
Figure 8: Number of Periods Preset
|
- Periods occurrence: month** / quarter / year (**when configured) (fig. 9)
|
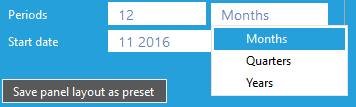
Figure 9: Periods occurrence Preset
|
- Start Date: Date of first period to display (fig. 10). Finalize a changed selection with "OK"
|
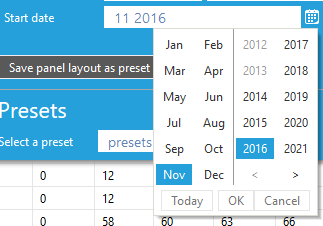
Figure 10: Start Date Preset
|
- Visualisation: Select Chart or Table.
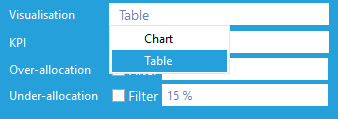
Figure 11: Select option "Chart" or "Table" from KPI
Set over- or under-allocated data to be highlighted in red. When Filter is checked only the over or under allocated data is displayed.
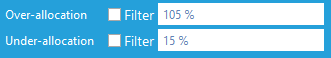
Figure 12: Select option "Chart" or "Table" from KPI
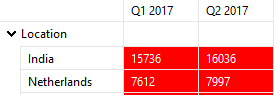
Figure 13: Over-allocated data
|
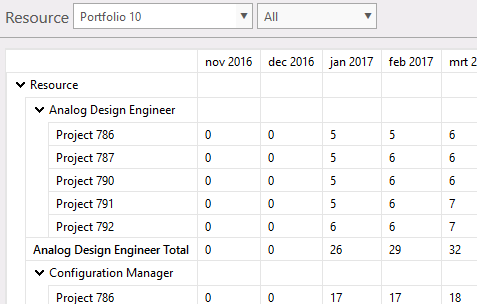
Figure 14: Show as Table
|
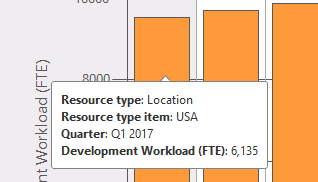
- KPI: Display Demand or Demand with Supply (fig. 15). This adds a line that indicates the set maximum available resources for that type at that time (fig. 16).
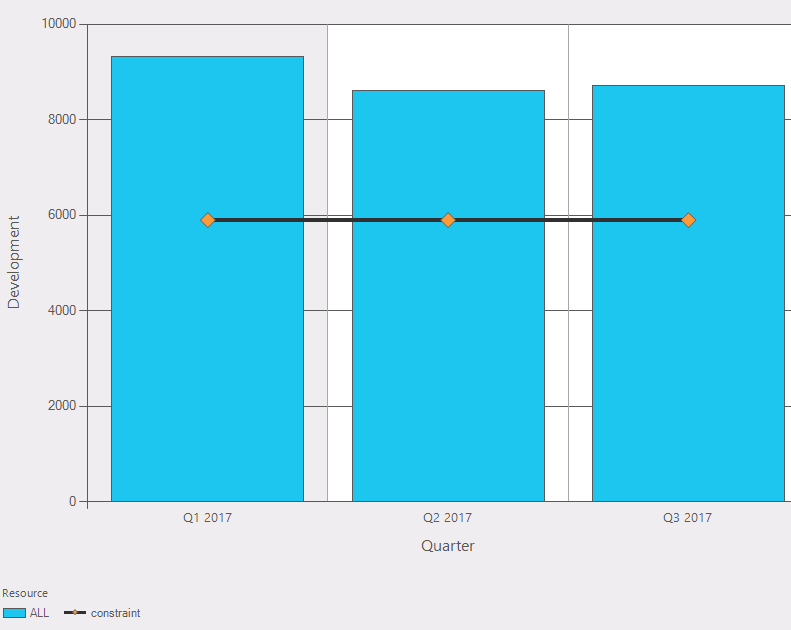
Figure 16: Show as Chart with Constraint/Supply line
|
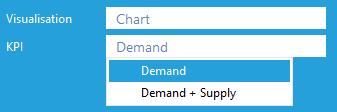
Figure 15: Show as Chart with Constraint/Supply line
|
- Select "Save panel layout as preset"
- Select "Save Chart to queue"
|
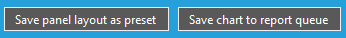
Figure 17: Buttons to save layout to preset or save chart to queue
|
Presets:
- Select a preset: - select a saved preset

Figure 18: Select a preset
After selecting presets, the settings can be saved as a panel preset. Options to select:
- Save panel layout; (fig. 19) (as in presets)
 Saving preset Saving preset 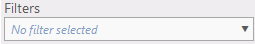 Use a filter with this preset. Use a filter with this preset.- Make this your default preset.
- Make this a preset for all users?
- Save it as a preset.
|
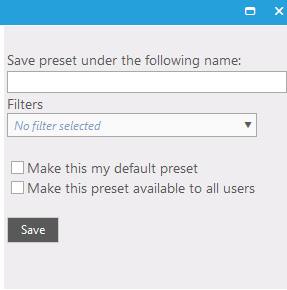
Figure 19: saving a preset
|
|